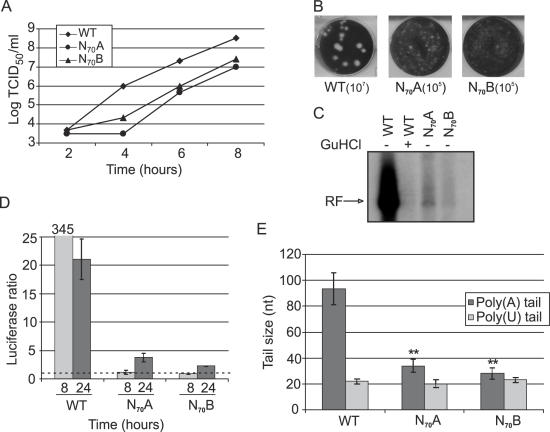
Figure 2.
Characterization of CVB3 3′NCR randomization mutants using single-cycle growth curves (A), in which the 50% tissue culture infective dose (TCID50) is set against the time of incubation (time), plaque assay, in which the dilution factor is indicated underneath the depicted well (B), and in vitro replication assay (C). GuHCl, guanidinium hydrochloride. (D) Luciferase activity of wt or mutant RNA determined 8 and 24 h post-transfection in BGM cells expressed as the fold difference between cells incubated in the presence and absence of GuHCl. (E) 3′-Poly(A) and 5′-poly(U) sizes of the Δ3′NCR-N70/A (N70A) and Δ3′NCR-N70/B (N70B) mutants. The 3′-poly(A) columns represent the means ± SD of three independent experiments; the 5′-poly(U) columns represent the means ± SD of 10 values. ** corresponds to P < 0.01.

