Figure 3.
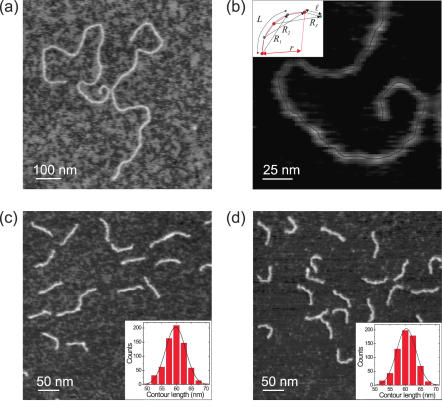
High-resolution AFM images of DNA samples. (a) Two representative DNA molecules of the PPC adsorbed on a mica surface. (b) Illustration of the data analysis and tracing of the DNA molecules. A segmented line made of points separated by ℓ = 2.5 nm follows the contour of the molecule. The important parameters we employ are the contour length spacing L, the end-to-end distance R and the curvature C defined as the inverse of the curvature radius r that embraces three contour points, C = 1/r. In the inset in (b), these parameters are shown together with an example of three values of R for the same contour length spacing L, in this case L = 3 × ℓ = 7.5 nm. We also show an example for the calculation of r for three points separated by L = 2 × ℓ = 5 nm (red arc). (c) AFM image of sample SQ100 and histogram of contour lengths L0 [inset in (c)]. (d) AFM image of sample SQ322 and histogram of contour lengths L0 [inset in (d)].

