
Figure 3.
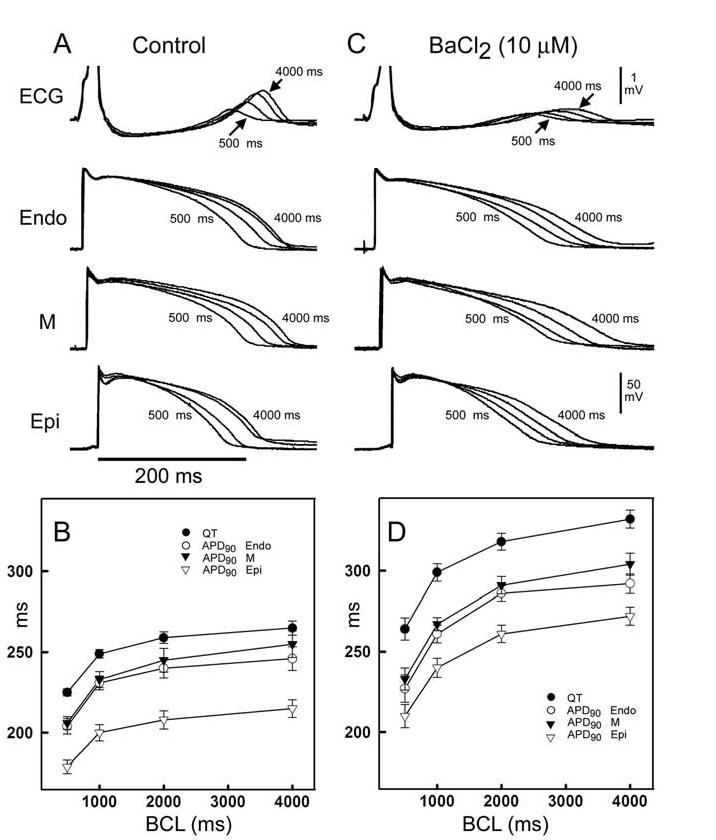
Rate-dependent changes of action potential (AP) characteristics and QT interval under control condition and in the presence of 10 μM BaCl2. Each trace shows superimposed APs recorded simultaneously from endocardial (Endo), midmyocardial (M), and epicardial (Epi) cells together with a transmural ECG at cycle lengths ranging from 500 to 4,000 ms. A: Control. B: Composite data of rate-dependent changes under control conditions. C, D: Recorded in the presence of 10 μM BaCl2. n = 8. Endo = endocardial APD90; Epi = epicardial APD90; M = midmyocardial APD90; QT = QT interval.