
Figure 6.
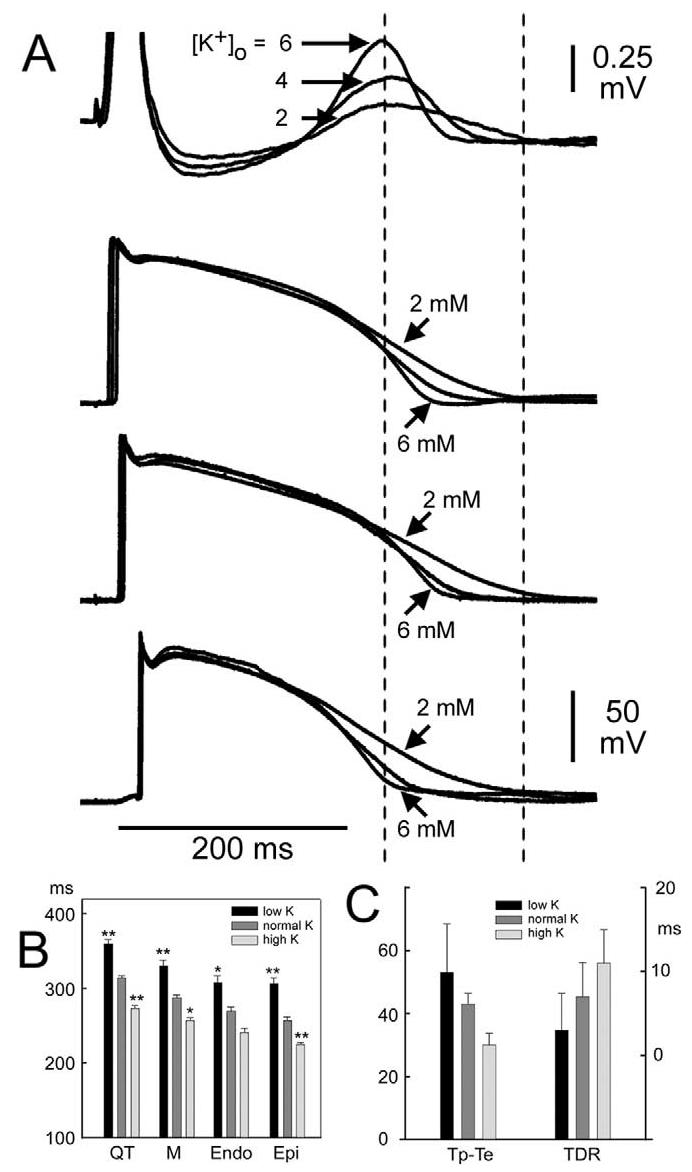
Effect of extracellular potassium level in the presence of 10 μM BaCl2. A: Superimposed action potentials simultaneously recorded from endocardial (Endo), midmyocardial (M), and epicardial (Epi) cells together with a transmural ECG at potassium concentrations of 2.0, 4.0, and 6.0 mM. B, C: Composite data of change in potassium level to low K (2.0 mM), normal K (4.0 mM), and high K (6.0 mM). Basic cycle length = 2,000 ms. n = 7. *P <.05 vs normal K; **P <.01 vs normal K.