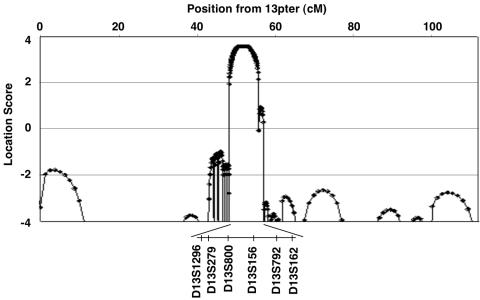
Figure 4. .
Location scores resulting from multipoint analysis of chromosome 13. The X-axis shows genetic distance from the telomere (in cM), and the Y-axis shows the location score, calculated using SimWalk2 software. The maximal location score of 3.57 is observed at markers D13S279-D13S800-D13S156.

