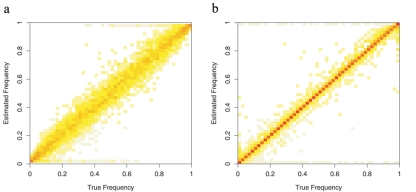
Figure 2. .
Estimation of two-marker haplotype frequency estimation. Unphased genotype data in 50 individuals were simulated on the basis of chromosome 22 haplotypes of the CEU individuals genotyped in the HapMap project. Each plot can be viewed as a two-dimensional histogram, in which the X-axis represents the true haplotype frequency, and the Y-axis represents the corresponding estimated frequencies. The intensity at each pixel indicates the height of the histogram, or the number of marker pairs whose true haplotype frequency is at the X-coordinate while the estimated haplotype frequency is at the Y-coordinate. a, Naive haplotype frequency estimates. Both allele frequencies and haplotype frequencies are estimated from a small sample of individuals. b, Augmented haplotype frequency estimates. Haplotype frequencies were estimated from same set of individuals as in panel a, but allele frequencies were estimated from a larger sample.

