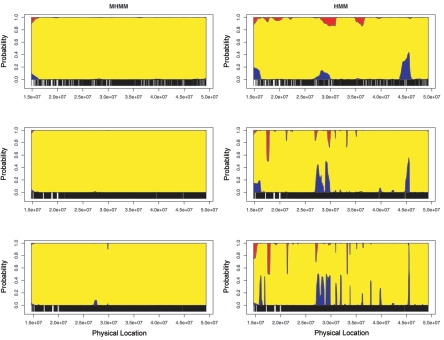
Figure 6. .
Estimated ancestry for a Han Chinese individual from Beijing. The Y-axis represents the posterior probability that one allele is derived from a specific ancestry; the X-axis indicates the physical locations of markers. Markers were sampled at an average spacing of 30 kb (top panels), 6 kb (middle panels), and 3 kb (bottom panels), which approximated the density of a 100K SNP chip, approximated the density of a 500K SNP chip, and used all HapMap SNPs, respectively. Left panels, MHMM correctly infers Asian ancestry (yellow) at most markers. Right panels, HMM assigns considerable probability of European ancestry (blue) or African ancestry (red) in several regions.

