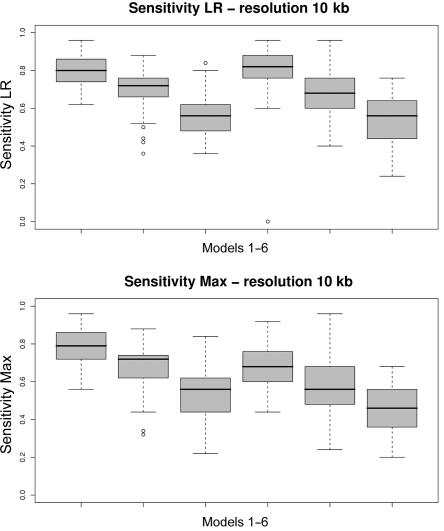
Figure 5. .
Box plots of the sensitivity measure for each of the six models (table 1). Fifty data sets are simulated according to each model, and the distribution of the resulting 50 sensitivity measures is depicted in each box plot. Average intermarker distance is 10 kb. A, LR. B, Max.

