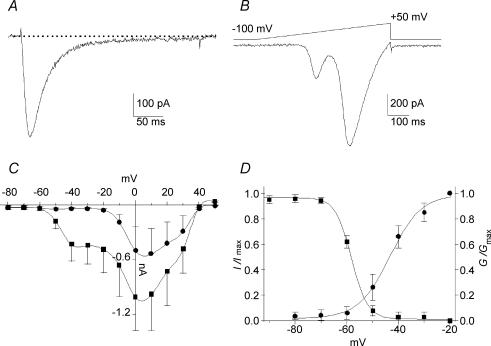
Figure 1. Calcium currents recorded in E17 primary vestibular neurones.
A, typical trace of T-type current recorded in a neurone displaying large current amplitude. The current was evoked by a −35 mV pulse, at voltage eliciting the maximum amplitude determined during a voltage ramp. B, corresponding voltage ramp from −100 to +50 mV (640 ms duration). C, I–V relationships of global calcium current recorded from Vh–100 mV from −80 to +50 mV (▪, peak current; •, sustained current). D, steady-state activation (•) and inactivation (▪) curves of T-current. The continuous lines represent the best-fits of the Boltzmann distribution. The overlap of activation and inactivation suggests a window current between −65 and −45 mV.

