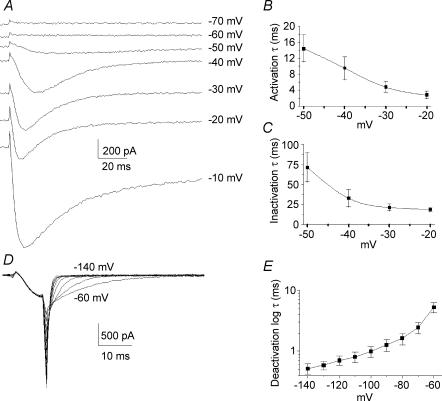
Figure 2. Activation, inactivation and deactivation properties of T-type current.
A, original traces showing calcium currents at various potentials between −70 and −10 mV. The T-type current activated between −60 and −50 mV while high-voltage-activated (HVA) currents activated below −20 mV. B, time constants of activation of T-type current as function of the voltage. C, time constants of inactivation of T-type current as a function of the voltage. Both time constants of activation and inactivation were voltage dependent and present an acceleration of between −50 and −20 mV. D, original traces showing tail currents obtained by deactivating pulses from −140 mV to −60 mV. Pipette and cell capacitances were corrected and series resistances reduced to about 85%. E, plot of mean deactivating time constants of the fit of the tail currents as a function of the voltage.

