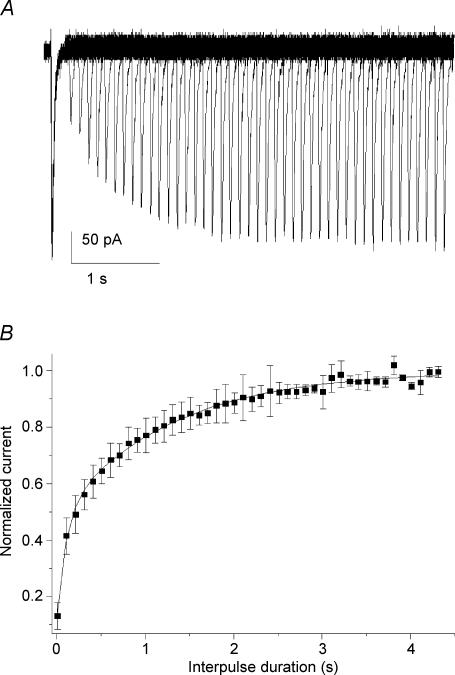
Figure 3. Time dependence of recovery following short inactivation.
A, superimposed current traces obtained in an E17 vestibular neurone showing the current growth when the interval of two paired pulses (100 ms, −42 mV) increased from 0 ms up to 4.4 s (step 100 ms). B, plot of the mean normalized current amplitudes as a function of the interpulse interval. The relationships were fitted with two exponentials (continuous line). The time constants were 102 ± 13 and 1281 ± 41 ms, and amplitudes 0.38 ± 0.03 and 0.53 ± 0.02 (n = 22) for the fast and slow components, respectively.

