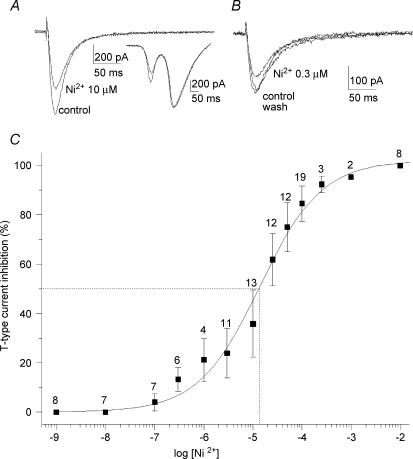
Figure 5. Effect of increasing concentration of Ni2+.
A, effect of 10 μm Ni2+ application on T-current. The HVA calcium currents were not affected (inset). B, reversible effect of 0.3 μm Ni2+ application on T-current. C, concentration dependence of the blockade of T-type current by Ni2+. The smooth curve represents the fit of the Hill equation revealing an IC50 of 13.4 μm. The Hill coefficient was 0.7 ± 0.1. Dotted lines illustrate the IC50. The number of observations is given above the error bars. The mechanosensitivity response is not reported in the curve.

