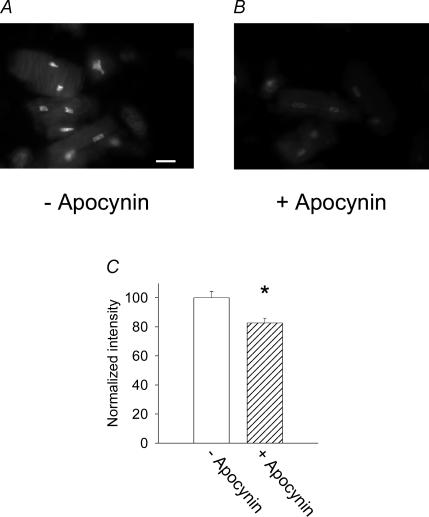
Figure 3. Effects of the NADPH inhibitor apocynin on DHE fluorescence (indicating superoxide anion levels).
Several cells and nuclei from diabetic male rats are shown either in the absence (A) or in the presence (B) of apocynin (300 μm, 6 h). Scale bar, 10 μm. C, mean (±s.e.m.) DHE fluorescence intensity in the absence (open bar, normalized as 100%) and presence of the drug (hatched bar), for one set of cells. *P < 0.05. A similar significant reduction of DHE intensity by apocynin was obtained in five other experiments.

