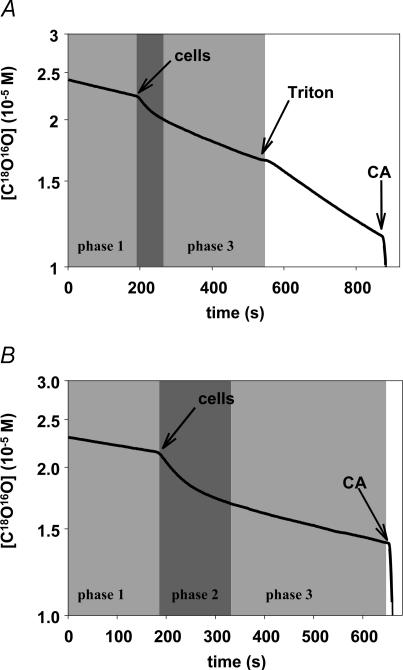
Figure 4. Original mass spectrometric recordings of the decay of C18O16O concentration in suspensions of isolated proximal colonocytes.
The first phase (phase 1) reflects the spontaneous decay of labelled CO2 in the absence of cells and of CA. After the additions of colonocytes, the second phase (phase 2, middle shaded area) exhibits a rapid fall in C18O16O, which is due to fast entry of C18O16O into the cells where it is rapidly converted into HC18O16O2− (this process requiring high membrane PCO2 and high intracellular CA activity). The subsequent slower phase (phase 3), among other processes, represents influx of HC18O16O2− into the cells and is governed by the membrane permeability for HCO3−. A, cells added at the arrow are isolated proximal colonocytes, no extracellular CA inhibitor is present. After addition of Triton X-100, all CA, extra- as well as intracellular, is directly accessible from the reaction solution and behaves therefore as CA in solution, giving a linear slope in the semi-logarithmic plot. The slope of this line over the slope of the initial phase in the figure represents total CA activity of the cells. B, proximal colonocytes were added at the arrow after having been pre-incubated in 10−5m STAPTPP, which continued to be present during the mass spectrometric experiment. Because Aex is inhibited here, the exchange process is determined by Ain, PCO2 and PHCO3. At the end of both experiments, soluble CA is added in excess to rapidly establish isotopic equilibrium.

