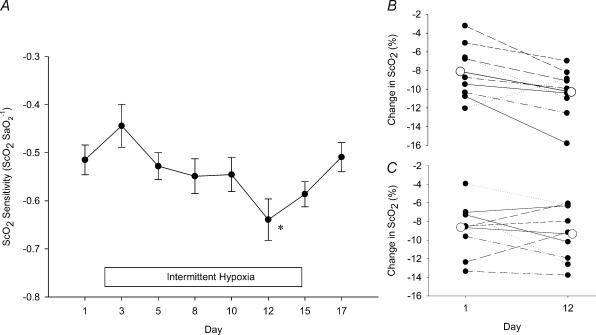
Figure 4. Effects of intermittent hypoxia on cerebral tissue oxygenation.
A, the effects of intermittent hypoxia on the ratio of the fall in cerebral tissue oxygen saturation to the fall in arterial oxyhemoglobin saturation (ΔScO2/ΔSaO2) during progressive hypoxia for both SDIH and LDIH subjects (cerebral tissue oxygen saturation sensitivity). The box indicates the period of the intermittent hypoxia intervention. Data points are means ± s.e.m.*Significantly different from day 1 (P > 0.001). B, the absolute change in ScO2 on days 1 and 12 at iso-SaO2 (83 ± 3%) for each subject in SDIH. All but one subject showed a greater reduction in ScO2 at day 12. C, the absolute change in ScO2 on days 1 and 12 at iso-SaO2 (83 ± 3%) for each subject in LDIH. Five of nine subjects show a greater reduction in ScO2 at day 12. The large open circle data points represent the group mean (for both B and C).

