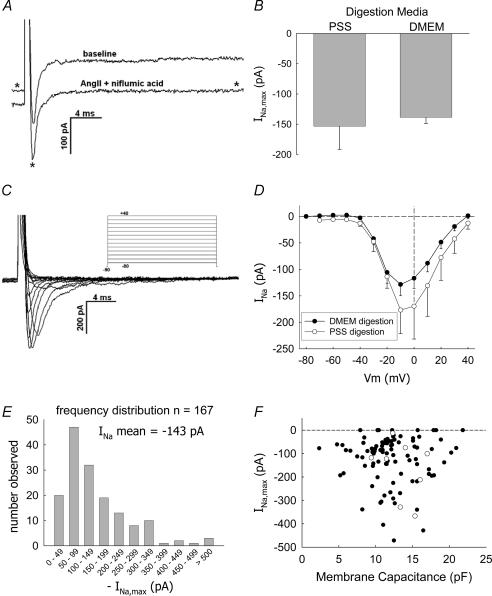
Figure 1. Depolarizing pulses elicit a rapidly deactivating inward current in DVR pericytes.
A, depolarization of a DVR pericyte from −90 mV to −10 mV elicits a rapidly inactivating inward current. Exposure to AngII (10 nm) and niflumic acid (100 μm) reduces the holding and end-pulse currents (trace identified with an asterisk) but does not affect the overall magnitude of the fast current (similar to n = 12, see Table 1 for summary). B, comparison of mean (± s.e.m.) maximal Na+ inward currents (INa,max) elicited from pericytes of DVR digested with Blendzyme in either DMEM (n = 155) or PSS (n = 9). C, example shows inward current traces obtained by depolarizing a DVR pericyte from −90 mV to the pulse potentials defined by the protocol in the inset. D, summary of peak INa as a function of pulse potential, mean (± s.e.m.), n = 23 cells digested in DMEM (•) and n = 9 cells digested in PSS (○). E, frequency distribution of the peak INa elicited from n = 167 cells. INa was generated by depolarizing from holding potentials of either −90 or −100 mV to a test potential of −10 mV. The mean INa was −143 pA. Data deviate significantly from a normal distribution with skewness and kurtosis of −2.7 and 12.1, respectively. F, graph shows maximal INa versus cell membrane capacitance (Cm) for cells in which the latter was recorded. Pericytes digested in DMEM (•) or PSS (○) are shown. The magnitude of INa does not correlate with Cm.

