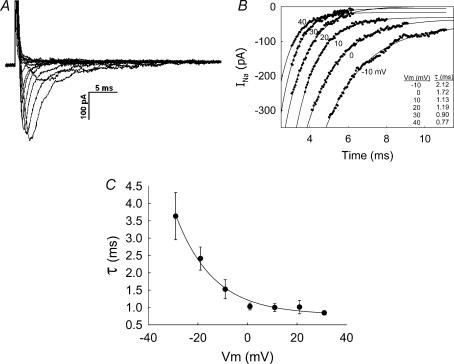
Figure 7. Inactivation of INa.
A, example shows inward current traces obtained by depolarizing a DVR pericyte from −90 mV to the pulse potentials as shown in the inset of Fig. 1A. B, the graph shows exponential fits to the post-peak deactivating currents of traces in A. Inset shows the time constants obtained by those fits for traces elicited by depolarizing test pulses between −10 and +40 mV. C, summary of the mean (± s.e.m.) time constants (τ, ordinate) obtained from seven cells that were analysed by the method illustrated in A and B. The line through the data has been fitted to an exponential.

