Figure 1.
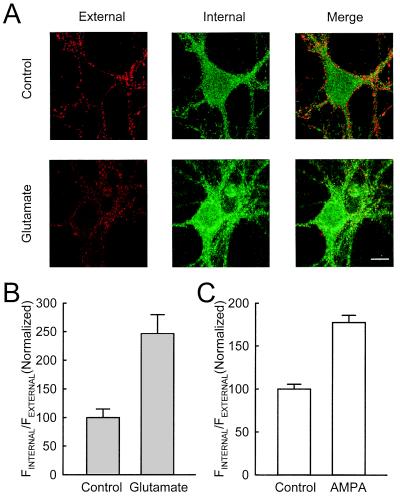
Glutamate and AMPA enhanced internalization of AMPARs. (A) Detection of internalization of AMPARs. In untreated cultures, clear staining of GluR1 is seen on the surface, along the edge of the cell body and dendrites (red), whereas the staining inside the cell body is more homogeneous and weak (green). This distribution is altered by incubation with glutamate: staining becomes weaker on the surface, but stronger inside the cell body that occupies the perinuclear region. (Scale bar: 10 μm.) (B) Quantification of internalization of AMPARs. Ratio of the fluorescence intensity inside the cell body vs. on the surface was calculated and used as an index for internalization. The results were normalized to the control group. In the groups treated with glutamate, a higher ratio is obtained (for control, n = 19 cells from 6 experiments; for glutamate, n = 16 cells from 6 experiments). (C) A similar change is observed when AMPA is applied (for control, n = 18 cells from 5 experiments; for AMPA, n = 19 cells from 5 experiments).

