Figure 4.
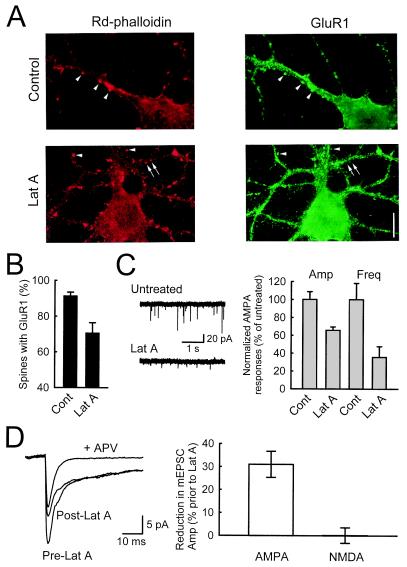
Lat A causes loss of AMPARs from synapses. (A) After cultures were treated with 20 μM lat A for 20 min, dendritic spines colocalized with GluR1 staining can still be seen (arrowheads, red for spines, green for GluR1), but there are also spines without GluR1 staining (arrows). (Scale bar: 10 μm.) (B) The percentage of spines with colocalized GluR1 staining decreases after treatment with lat A, indicating that AMPARs are dissociated from their anchorings in the postsynaptic density (n = 10 and 9 for control and lat A, respectively, from three experiments). (C) A significant reduction in both the amplitude and frequency of AMPAR mEPSCs is observed in cultures treated with lat A. Sample AMPAR mEPSCs are shown in Left for untreated and lat A-treated cultures, whereas population data from 11 cells are shown in the Right. (D) Reduction in AMPAR mEPSCs occurs in the absence of changes in NMDAR mEPSCs. Dual component mEPSCs were collected, and averaged responses from the same cell are shown in the Left. After perfusion with lat A, a significant reduction in the peak amplitude is observed, but there is no change in the slow component (n = 5 cells). Pharmacological isolation of AMPAR mEPSC with APV shows that the peak is mainly due to AMPAR activation, whereas the slow component is exclusively mediated by NMDARs.

