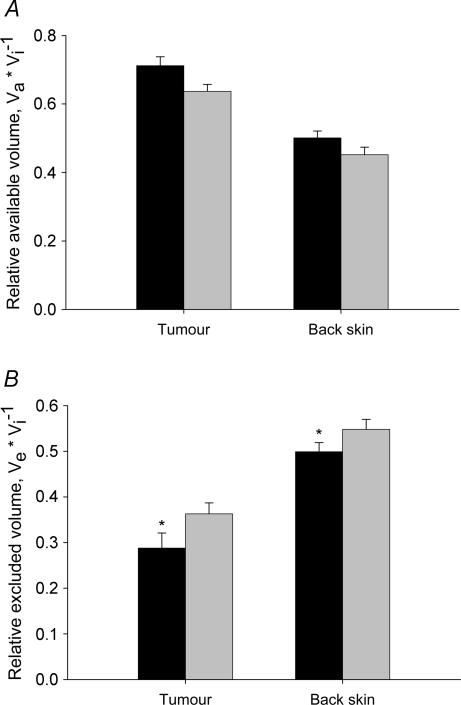
Figure 4. Relative available and excluded interstitial volumes of immunoglobulins.
A, relative available volume of trastuzumab (pI = 9.2) (black bars) and IgG (pI = 7.6) (shaded bars) in tumour and back skin. Error bars: 1 s.e.m.B, relative excluded volume for the same substances and tissues as described in A, using the same symbols. The more positive trastuzumab had a significantly lower excluded volume compared to the more neutral IgG. Error bars: 1 s.e.m.*P < 0.05 when compared to IgG in corresponding tissue.

