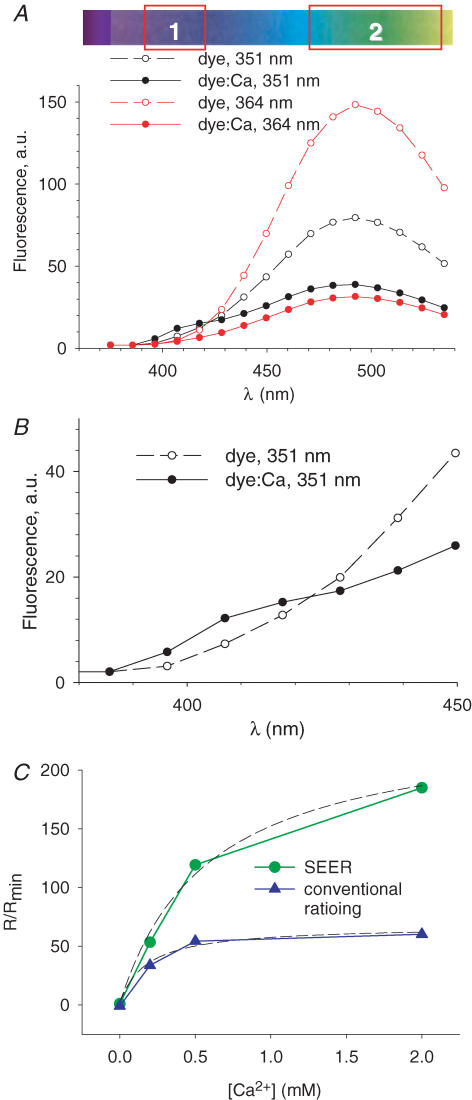
Figure 2. Spectra and calibration in solution.
A, emission spectra measured with the experimental laser scanning microscope, aqueous solutions and chambers. Each point corresponds to emission in successive 10 nm-wide wavelength bands, recorded in solutions with 25 μm mag-indo-1, either free (open symbols), or saturated with Ca2+, excited at 351 nm (black) or 364 nm (red). B, data for 351 nm excitation on an expanded wavelength scale, showing an isosbestic point at 425 nm. The ranges represented by boxes 1 and 2 in the diagram at top represent the ranges used for measurements in cells, which did not agree in detail with the optimal ranges in solution. C, titration of the dye by Ca2+. Blue symbols: conventional emission ratios, namely ratios of fluorescence F11 (excited at 351 nm in the 10 nm emission range centred at 408 nm) and fluorescence F12 (excited at 351 nm in the 10 nm emission range centred at 492 nm). Green symbols: SEER ratioing, namely fluorescence F11 divided by F22, which is excited at 364 nm in the emission range centred at 492 nm. Dashed curves: best fits by eqn (8), with free parameters Rmax/Rmin (the asymptotic value) and KD, the mid-signal concentration. Note that both parameters are more than 3 times greater with SEER.

