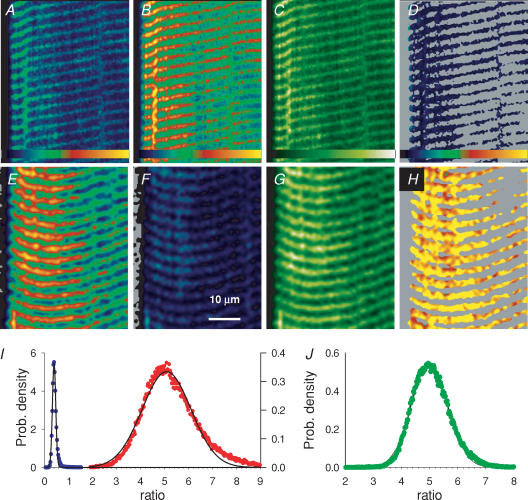
Figure 6. Calibrations in situ.
A and B, F11(x,y) and F22(x,y) images, respectively, from a cell with permeabilized SR exposed to a nominally Ca2+-free solution. C, DT(x,y), derived from A and B by eqn (A12). D, R=F11/F22, masked to areas in the two upper quartiles of the distribution of DT (‘dye-restricted masking’). Identifier: 031605c_008. E and F, images F11 and F22, respectively, from a cell with intact SR, exposed to an internal solution with 30 μm[Ca2+] and 0.5 mm tetracaine. G, DT(x,y), derived from E and F. H, ratio image, from E and F, masked to the two top quartiles of the distribution of DT. Identifier: 031505c_014. Colour tables span the range 0–255 for A, B, E and F; 0–50 μm for C and G; 0–4.25 for D and H. I, histograms of the ratio images D (blue) and H (red), with gaussian fits (lines) of means 0.406 and 5.080. J, histogram of the ratio image from a fibre stained with indo-1 and treated as described for E–H. Gaussian fit (line) has mean of 4.98. Identifier: 31805a_024.

