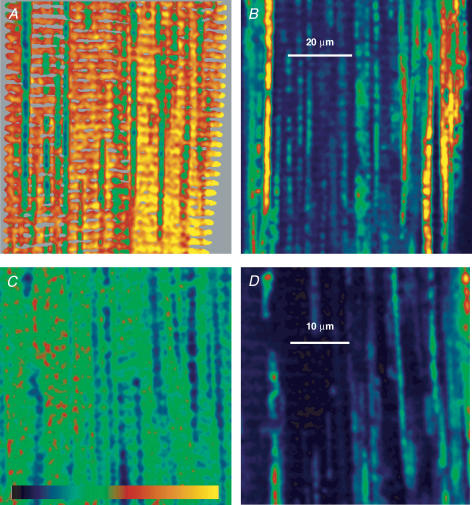
Figure 8. SEER resolves mitochondria.
A, ratio image of a cell loaded with mag-indo-1 and rhod-2, then membrane-permeabilized and immersed in a 100 nm [Ca2+] solution. (Image is masked to the three upper quartiles of DT.) B, simultaneously acquired image of rhod-2 fluorescence. Note detailed correspondence between low [Ca2+] regions in A and rhod-2 stained mitochondria in B, but greater heterogeneity in mitochodrial staining by rhod-2. Identifier: 022504a_11. C, ratio image of a cell loaded with mag-indo-1, membrane-permeabilized and exposed to a cytosolic solution with 100 nm[Ca2+] and Mitrotracker green. D, simultaneously acquired image of Mitotracker fluorescence. Again, there is detailed correspondence between mitochondrial staining by Mitotracker and regions of low [Ca2+] in C. Identifier:092403b_9. Colour table spans the range 0–3.5 for A and C; 0–255 for B and D.

