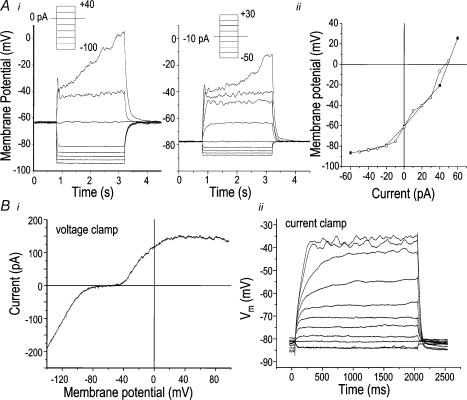
Figure 2. Non-linear relationship between current and voltage in microglia reveals high-resistance regions.
A, representative current-clamp recordings of membrane potential (Vm) from a microglial cell that had small Kv1.3 and inward rectifier (Kir) currents (see text). The uncorrected resting potential was −64 mV and Vm changes were evoked by steps of current (see inset) superimposed on a holding current of 0 pA (left) or −10 pA (right) (i). Voltage–current relations from the recordings in i, with a holding current of 0 pA (▪) or −10 pA (○). Vm values were measured at the 1000 ms time point and plotted against the injected current (ii). B, relationship between voltage- and current-clamp recordings in a representative untreated microglial cell that was also used for comparison in Fig. 3B. Under voltage-clamp, a voltage ramp from −120 to +80 mV was applied from a holding potential of −80 mV. This cell had relatively little Kir (inward current below −80 mV) and Kv1.3 (outward current above −40 mV). Note the extremely small current between −80 and −40 mV, indicating a total resistance of about 2.6 GΩ(i). (ii) Conventional current clamp. The traces are Vm responses to steps of injected current between −50 and +15 pA (in 5-pA increments), with a holding current of −40 pA, chosen to set the initial Vm to the Nernst potential for K+ (EK; about −85 mV).

