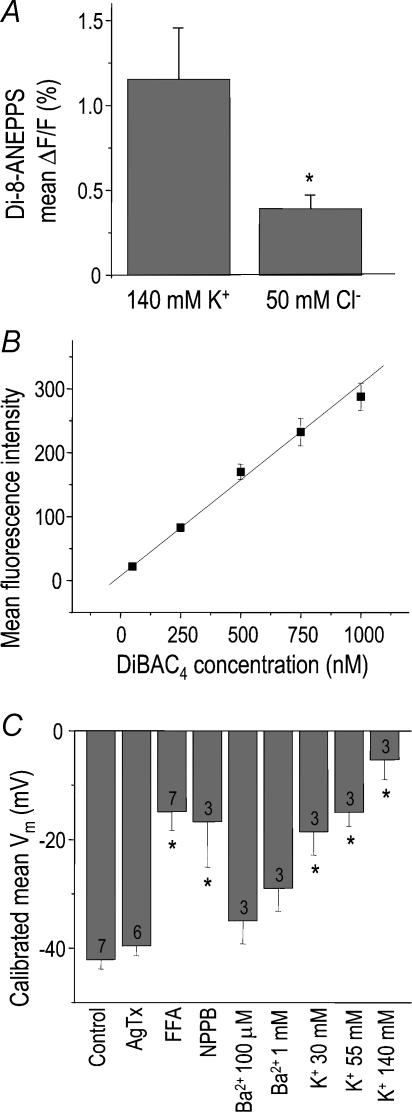
Figure 5. Non-invasive dye measurements of membrane potential in microglia.
A, initial evidence that a chloride conductance contributes to the membrane potential (Vm). The fast dye, Di-8-ANEPPS, was used in combination with fast solution changes as in Fig. 3. For each of five cells, the mean change in fluorescence (±s.e.m.) in response to 25 switches in the bath solution was divided by the total fluorescence (*P < 0.05; Student's t test). B, calibration of the more sensitive voltage-dependent dye, DiBAC4, using flow cytometry on microglia. First, the membrane potential of all cell batches was set to 0 mV using 1 μm gramicidin, and then varying concentrations of DiBAC4 were applied to the cells for ∼20 min before monitoring cell fluorescence with a flow cytometer (see Methods). This representative experiment shows the linear relationship between intracellular dye concentration and mean fluorescence intensity, from which the actual Vm was calculated. C, effects of ion-channel blockers and K+ concentrations on the mean membrane potential (Vm) of microglia. Vm values were determined using DiBAC4 (see Methods and B). Values are mean ±s.e.m. for the number of separate cell batches indicated on each bar (*P < 0.05; ANOVA with Bonferroni correction for multiple comparisons). Bath solutions contained normal saline with 5 mm K+ and 134 mm Cl− (control) and normal saline to which compounds were added (10 nm agitoxin-2, 150 μm flufenamic acid, 100 μm NPPB, 100 μm or 1 mm BaCl2) or saline in which the K+ concentration was raised to 30, 55 or 140 mm in exchange for Na+.

