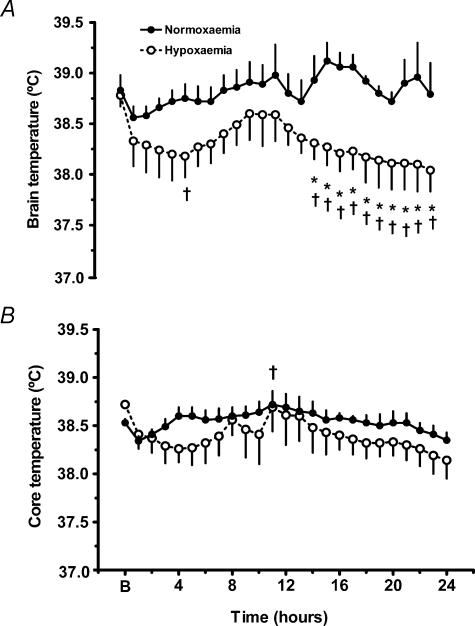
Figure 1. Cerebral and core temperature in fetal llama during 24 h of hypoxaemia.
Brain cortex (A) and core (B) temperatures. Values are expressed as means ±s.e.m.; n = 5 for each group. B is the mean basal temperature obtained during 1 h before starting the hypoxaemia. A, Normoxaemia (•) versus hypoxaemia (○), *P < 0.05, two-way ANOVA for repeated measures and Newman-Keuls test. Hour 4 and hours 15–24 of hypoxaemia versus basal, †P < 0.05, one-way ANOVA for repeated measures and Newman-Keuls test. B, hour 1 versus hour 11, †P < 0.05, one-way ANOVA for repeated measures and Newman-Keuls test.

