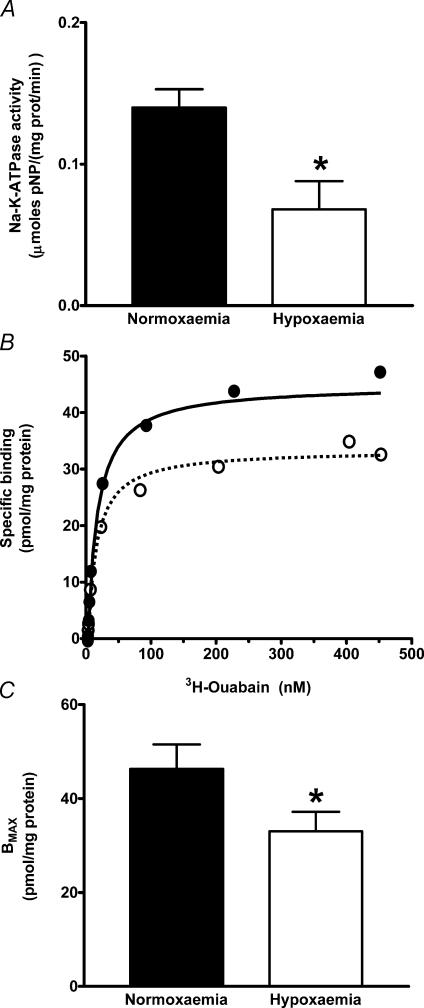
Figure 3. Na+–K+-ATPase in fetal llama brain cortex submitted to 24 h of hypoxaemia.
A, Na+–K+-ATPase activity; B, representative ouabain binding saturation curves; C, calculated maximal binding (BMAX). Values are expressed as means ±s.e.m.; n = 5 for each group; *P < 0.05, unpaired Student's t test. Normoxaemia (filled bars, •) versus hypoxaemia (open bars, ○).

