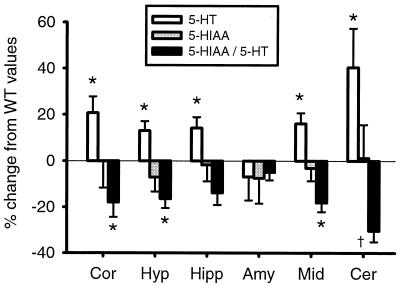
Figure 1.
5-HT, 5-HIAA, and 5-HT turnover (5-HIAA/5-HT ratio) determinations by HPLC in cerebral cortex (Cor), hypothalamus (Hyp), hippocampus (Hipp), amygdala (Amy), midbrain (Mid), and cerebellum (Cer) of nNOS−/− mice as compared with WT. The levels of 5-HT, 5-HIAA (ng/mg tissue), and 5-HT turnover in WT mice are as follows (±SEM): Cor = 0.349 ± 0.012, 0.134 ± 0.005, 0.386 ± 0.018 (n = 6); Hyp = 1.200 ± 0.038, 0.683 ± 0.043, 0.569 ± 0.032 (n = 6); hipp = 0.614 ± 0.019, 0.351 ± 0.027, 0.571 ± 0.038 (n = 6); Amy = 0.807 ± 0.056, 0.364 ± 0.023, 0.470 ± 0.060 (n = 6); Mid = 0.949 ± 0.023, 0.557 ± 0.035, 0.586 ± 0.031 (n = 5); Cer = 0.093 ± 0.005, 0.100 ± 0.005, 1.094 ± 0.086 (n = 6), respectively. In nNOS−/− mice, n = 6 for Hyp, Hipp, Mid, and Cer; n = 5 for Cor and Amy. Data are percent change in relation to WT mice ± SEM; *, P < 0.05 by Student's t test.

