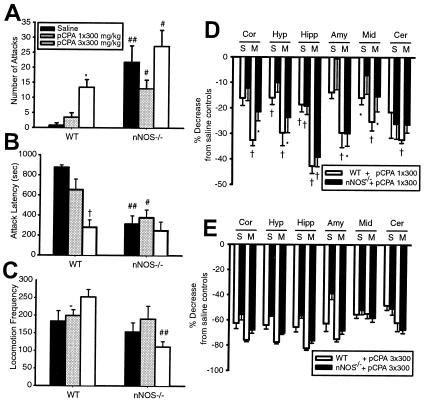
Figure 3.
Increase in aggressive behavior and 5-HT reduction by the 5-HT synthesis inhibitor pCPA. (A and B) Aggressive behavior as measured by the resident–intruder test 72 h after 0.9% saline solution (single injection, n = 5 for each genotype; three daily injections, n = 4 each genotype; group collectively named as saline because no differences are detected), single dose of 300 mg/kg pCPA (1 × 300, n = 10 each genotype) or three doses of 300 mg/kg pCPA (72, 48, and 24 h before tests, 3 × 300, n = 7 each genotype) i.p. injections in WT and nNOS−/− mice. (C) Locomotor activity in an open field 74 h after first i.p. injection (n = 6–10 in each group). *, P < 0.05; †, P < 0.01 in relation to saline in the same genotype; and #, P < 0.05; and ##, P < 0.01 in relation to WT same treatment. Data are means ± SEM and were analyzed by using two-way ANOVA (genotype × treatment) with post hoc Tukey test. (D and E) HPLC determinations of 5-HT (S) and its metabolite 5-HIAA (M) in the cerebral cortex (Cor), hypothalamus (Hyp), hippocampus (Hipp), amygdala (Amy), midbrain (Mid), and cerebellum (Cer) of WT and nNOS−/− mice 75 h after single i.p. injection of 300 mg/kg pCPA (D) and 3 × 300 mg/kg pCPA (E). Data are percent decrease from saline group in each genotype (means ± SEM, n = 5–6 mice each group). *, P < 0.05; and †, P < 0.01 in relation to saline in the same genotype. In E, all data are P < 0.05 or P < 0.01 in relation to saline controls (two-way ANOVA with post hoc Tukey test).

