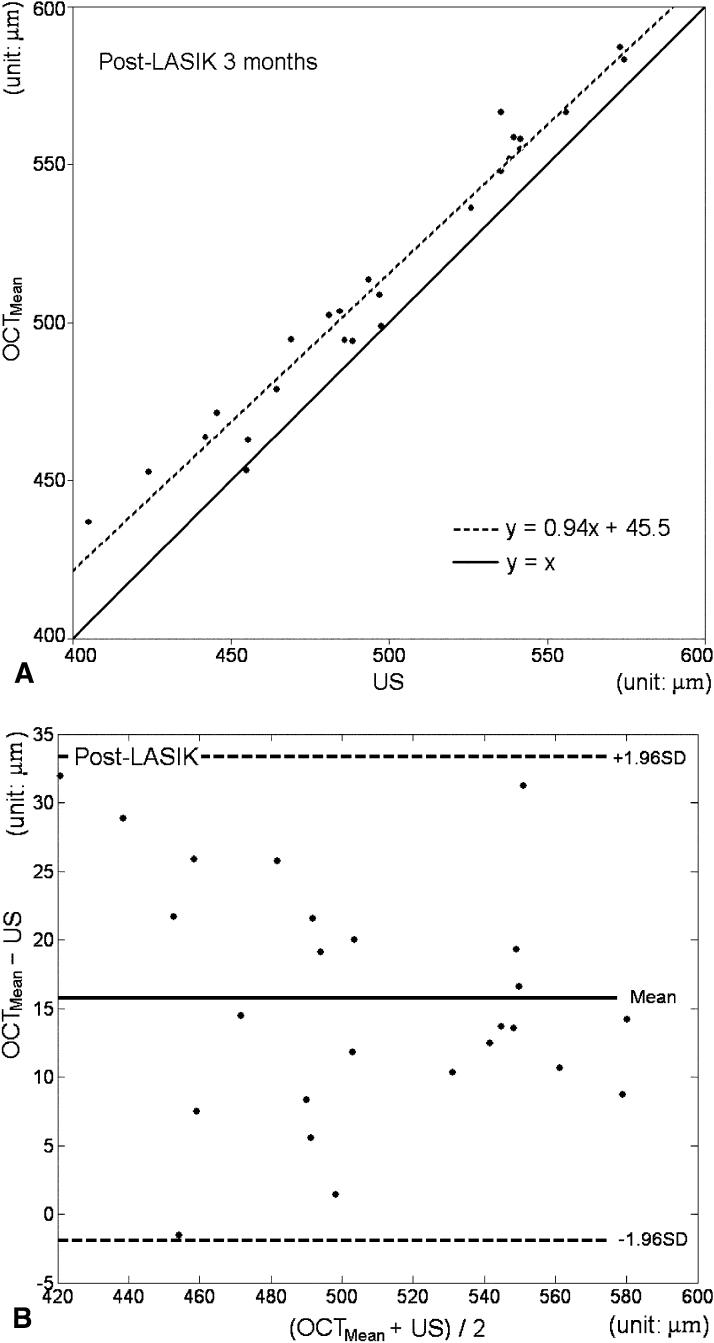
Figure 5.
Post-LASIK optical coherence tomography (OCT) central corneal thickness compared with the ultrasound (US) pachymetry measurement. OCTMean = average OCT corneal thickness over the central zone. A, Regression analysis plot. y = x is the line of equality. The 95% confidence interval (CI) of the slope was 0.862 to 1.018. The 95% CI of the y intercept was 6.7 to 84.3 μm. The R2 of the fit was 0.964. B, Bland–Altman plot. The distribution of the mean (x axis) and the difference (y axis) between US pachymetry and OCT reflects the level of agreement. The mean difference was 15.7 μm, with 95% limits of agreement from −1.6 to 33 μm. SD = standard deviation.

