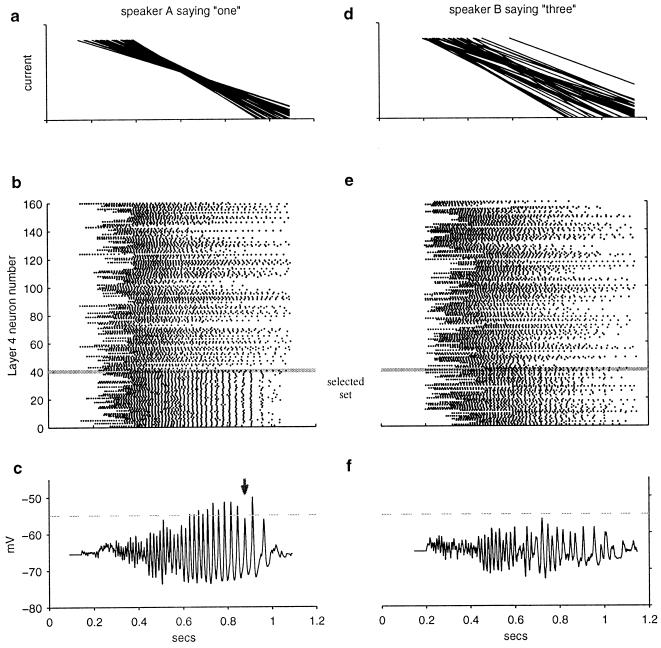
Figure 2.
Synchronization indicates recognition of an input pattern that is a similar (within time warp) version of the target pattern. (a) The 40 currents from area A that converge in response to the target template. Here, they almost converge near t = 0.6 sec in response to a pattern similar but not identical to the target. (b) Spike rasters of responses of 160 α or β neurons. Each dot represents an action potential, and each row corresponds to a single neuron. Shown below the gray line, 40 of the neurons belong to the selected set, driven by the currents shown in a, that corresponds to the target pattern. Note the neurons' synchronization. The other 120 neurons (above the gray line) are drawn randomly from the rest of the population of α and β neurons. (c) Intracellular potential of the γ neuron that receives input from the selected set of α and β neurons. The γ neuron spiking threshold has been set to infinity here to allow full observation of the synaptically driven membrane potential; γ neuron-firing threshold is normally −55 mV (horizontal dashed line). Synchronized input leads to strong oscillations and many threshold crossings. Random fluctuations in the oscillation amplitude can lead to occasional “missing” γ spikes (arrow). (d, e, and f) Same format as in a, b, and c in response to a nontarget pattern. (d) Input currents do not converge. (e) Neurons synchronize only weakly. (f) γ cell does not fire.

