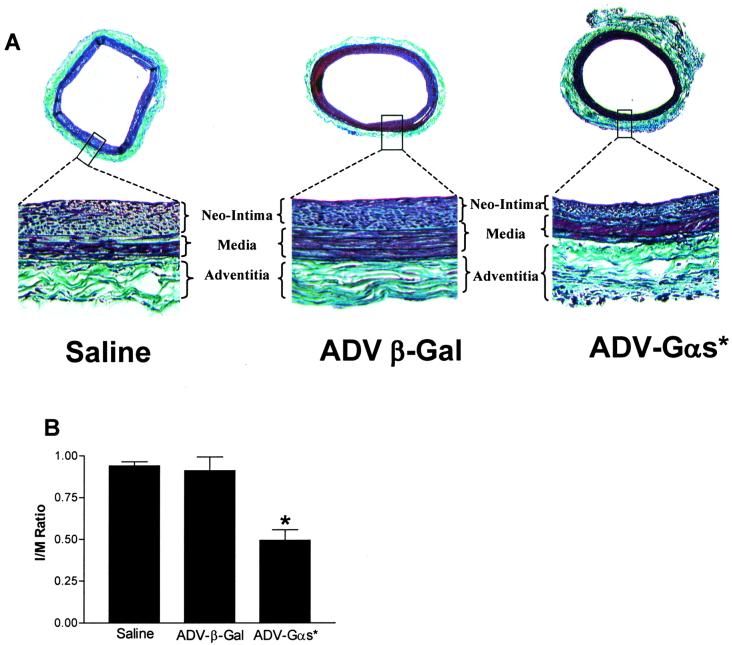
Figure 4.
Neointima formation in carotid arteries of rat subjected to balloon angioplasty and treated with saline (n = 5), ADV-β-gal (n = 16), or ADV-αs* (n = 23). (A Upper) Typical stained cross sections (×25). (A Lower) Enlargement of each boxed region (×100). (B) Neointima to media ratio for the three groups are shown. Values are mean ± SE of the indicated number of animals in each group (*, P < 0.05 ADV-αs*-treated cells vs. control and ADV-β-gal-treated cells; ANOVA)

