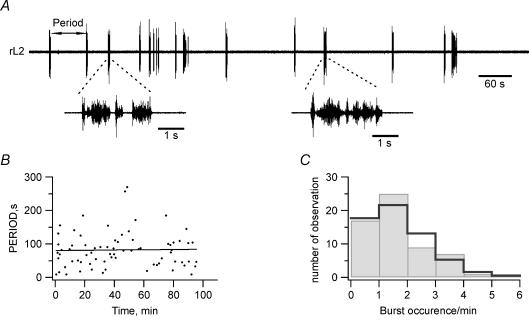
Figure 1. Characterization of spontaneous strychinine–bicuculline-induced bursting activity in the isolated neonatal rat spinal cord.
A, extracellular recording from the second right lumbar ventral root (rL2). B, plot of motor burst period (time between 2 successive bursts) versus time during a 100 min recording sequence. The horizontal linear fit (r= 0.02) indicates that there was no change in burst period with time. C, burst period distribution; grey bars in the plot correspond to the number of observations (y axis) made for each category (x axis) per time unit. Black line indicates theoretical Poisson distribution.

