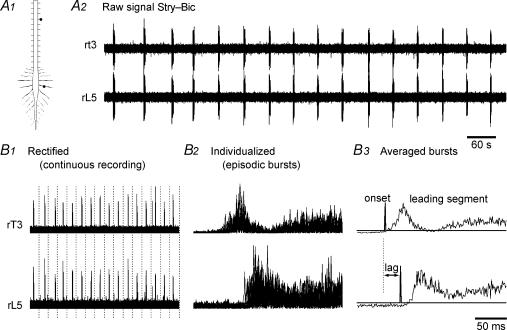
Figure 5. Analysis of Stry–Bic-induced bursts of action potentials.
A, diagram of the experimental preparation (A1) and sample simultaneous recordings from two ventral roots (A2). B, bursts were rectified (B1), then each cycle was identified and the episodes were superimposed (B2) to obtain an averaged burst (B3). Dashed lines in B1 indicate how bursts were individualized. Alignments were based on the onset detection of a reference trace (here rT3). For each trace the onset of a burst was calculated and the lag to a different root burst was measured, taking the leading segment burst as zero.

