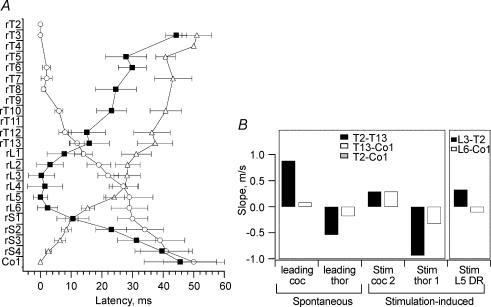
Figure 8. Intersegmental lags during spinal cord electrical stimulation.
A, mean lag diagram after stimulation (1 shock, 0.5 ms; 3 V) of the rostral spinal cord (T1, ○), coccygeal area (Co2, Δ, or L5 dorsal roots (▪). B, plots of lag slope during Stry–Bic-induced bursting (leading burst in either the coccygeal area (coc) or the thoracic area (thor)), during electrical stimulation of spinal cord (at Co2 or Thor1) and L5 dorsal root. The key panel above the histogram indicates the portion of curve on which the corresponding slope was calculated. The slope value expressed in m s−1 assumes that the length of each segment is 1 mm.

