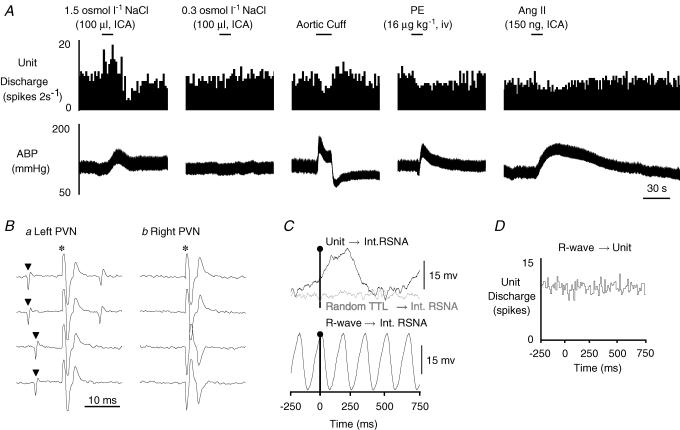
Figure 1. Example of a type I MnPO-PVN neurone.
A, ICA injection of hypertonic NaCl but not isotonic saline significantly increased cell discharge. This neurone was also barosensitive as increases in ABP produced by inflation of an aortic cuff or the α-adrenergic agonist phenylephrine (PE) each decreased neuronal firing rate. ICA injection of Ang II slightly but significantly decreased cell discharge. B, this neurone was antidromically activated from the left PVN with a constant onset latency of 10 ms and activation threshold of 300 μA (a, top two traces). The antidromic spike collided with a spontaneous action potential (a, bottom two traces), and the neurone also followed high frequency stimulation (> 333 Hz, trace not shown). In contrast, the neurone could not be antidromically activated with a high stimulus intensity (1 mA, 1 ms) from the contralateral PVN (b). C, baseline unit discharge positively correlated with renal SNA (RSNA, top trace, peak latency: 240 ms). Note that renal SNA showed no obvious correlation with randomly occurring square-wave pulses (random TTL→ Int RSNA, middle trace) generated at frequencies similar to the spontaneous discharge of the recorded neurone. The bottom trace shows that renal SNA is tightly coupled to the cardiac cycle during the same time as revealed by R-wave-triggered averages of renal SNA. D, R-wave-triggered average of unit discharge demonstrates that this MnPO-PVN neurone had no obvious correlation with the cardiac cycle. The spike-triggered averages and histograms presented in C and D were constructed from 7346 spontaneous unit discharges. ▴, spontaneous action potential; *, stimulus artifact.

