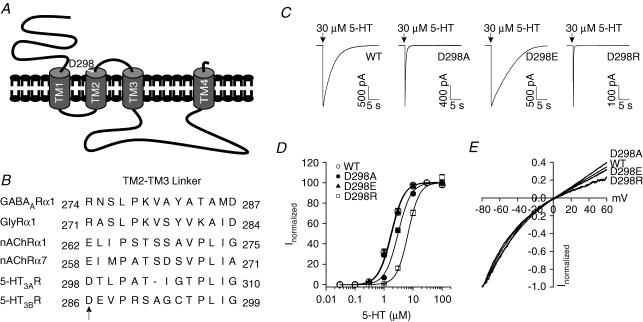
Figure 1. Position of D298 and effects of the D298 mutations on 5-HT concentration–response and I–V relationships.
A, putative topology of the 5-HT3A receptor. The arrow indicates the position of D298. B, sequence alignment of the TM2–TM3 loop from the Cys-loop ligand-gated ion channels. Arrow indicates the site of mutations. C, traces show current activated by 30 μm 5-HT from individual HEK 293 cells expressing the wild-type (WT) and mutant receptors. Arrows indicate the application of agonist. D, concentration–response curves of 5-HT-activated currents for the WT and mutant receptors. Data were normalized to peak current activated by 30 μm 5-HT for each cell. Each data point represents mean ±s.e.m. from 5 to 23 cells. Note the overlapping of curves for the WT and D298E receptors. E, voltage ramps obtained at the peak of current activated by 3 μm 5-HT. Currents activated by the voltage protocol in the absence of 5-HT have been subtracted. Data are normalized to the current amplitude obtained at −80 mV. Similar results were obtained from 5 to 7 cells.

