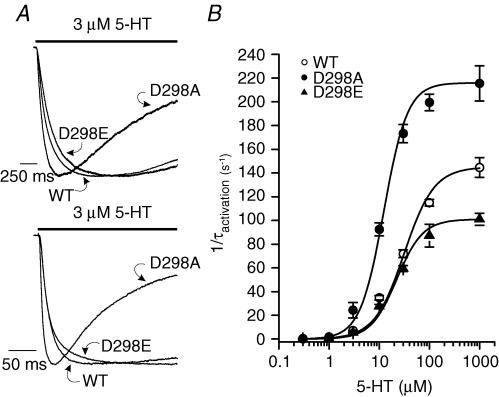
Figure 2. D298 mutations alter 5-HT3A receptor activation kinetics.
A, traces show receptor activation elicited by 3 μm (upper) and 30 μm (lower) 5-HT. The responses were normalized to peak current for comparison. The bar indicates the time of agonist application. B, plot of the activation rate (1/τact) versus 5-HT concentration. Each data point represents mean ±s.e.m. from 8 to 55 cells.

