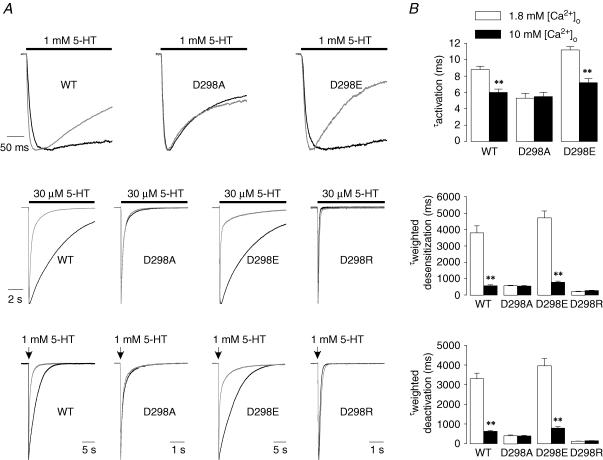
Figure 7. Effects of increasing [Ca2+]o on the kinetics of 5-HT-activated currents in the WT and mutant receptors.
A, traces show alteration in activation, desensitization and deactivation by increasing [Ca2+]o from 1.8 to 10 mm (upper, receptor activation elicited by 1 mm 5-HT; middle, desensitization of 30 μm 5-HT-activated current; lower, deactivation after termination of 2 ms application of 1 mm 5-HT). Currents were normalized to peak current and superimposed for comparison. The bar indicates the time of agonist application, and the arrow indicates the time point of application of agonist for 2 ms. Note the overlapping of the desensitization traces for the D298A and D298R receptors in 1.8 and 10 mm [Ca2+]o. Also note that the deactivation traces for the D298A and D298R receptors have faster time scale and the traces in 1.8 and 10 mm [Ca2+]o are almost completely superimposed. B, averaged data show the alteration in activation (upper), desensitization (middle) and deactivation (lower). Each bar represents mean ±s.e.m. from 7 to 14 cells. **P < 0.01. The traces obtained in 1.8 mm [Ca2+]o are in black, whereas those obtained in 10 mm [Ca2+]o are in grey.

