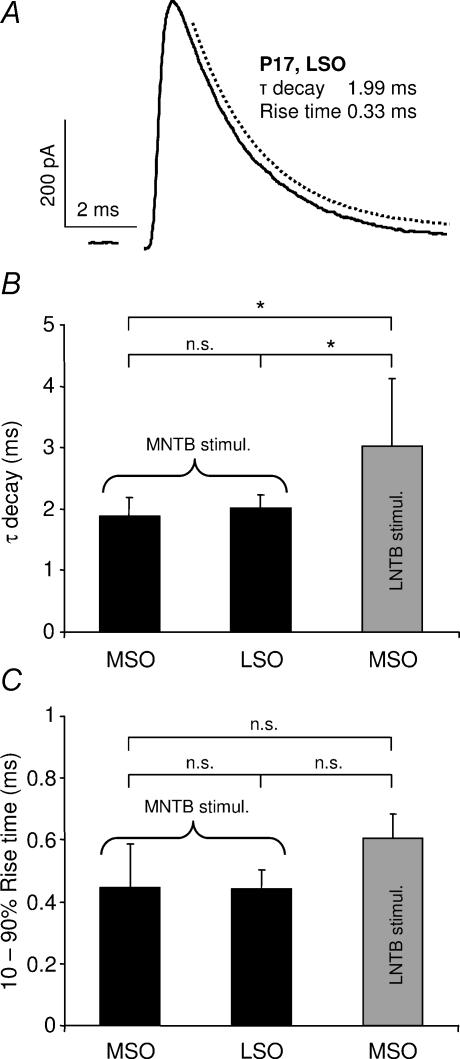
Figure 9. Comparison of glycinergic inputs to the superior olivary complex in P17 gerbils.
A, example of an IPSC evoked by MNTB fibre stimulation in an LSO principal cell. The decay time-course was estimated by fitting a single exponential function to the response (broken line). The sample record represents an average of 20 responses. The stimulus artefact has been deleted. B, comparison of the mean IPSC τdecay and C, the mean 10–90% rise time during MNTB fibre stimulation in the MSO (n = 8) and LSO (n = 7) or during LNTB fibre stimulation in the MSO (n = 3). Error bars represent 95% confidence intervals. n.s., not significant. *P < 0.05.

