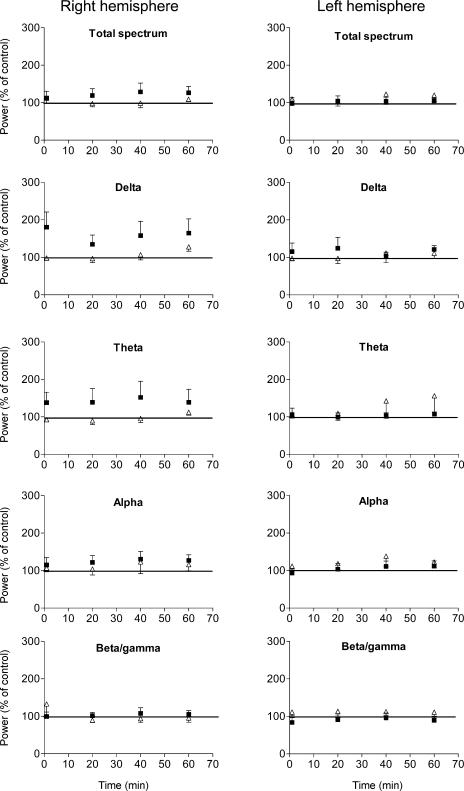
Figure 3. Effect of transcranial direct current stimulation (tDCS) and sham tDCS on the power of EEG rhythms.
▪: power spectral density (PSD) after tDCS offset (tDCS: right hemisphere cathodal polarity, left hemisphere anodal polarity, six subjects); Δ, PSD after sham stimulation (five subjects). Y-axes: power expressed as a percentage of the control value estimated on the EEG signal acquired for 30 min before scalp tDCS. Error bars show the s.e.m. Note the increased delta and theta rhythms after cathodal tDCS.

