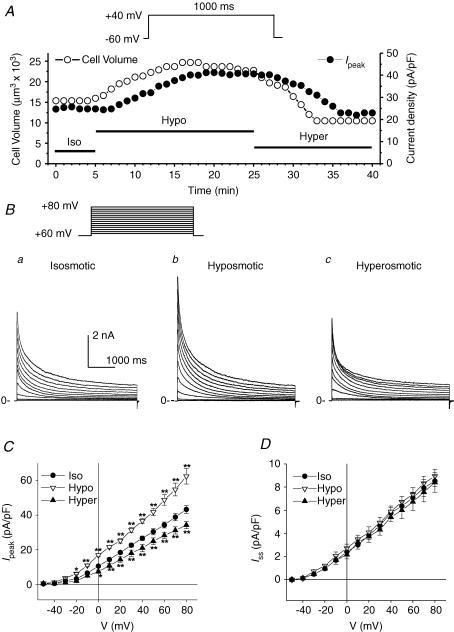
Figure 2. Effects of osmotic stress on cell volume and transient outward K+ currents in mouse ventricular apex myocytes.
A, representative time course of changes in cell volume (•, y-axis on the left) and peak transient outward K+ current density (•, y-axis on the right) in a single mouse ventricular myocyte under different osmotic conditions. Cell volume and the whole-cell outward currents elicited by a 1-s depolarizing voltage pulse to +40 mV from a holding potential of −60 mV were continuously monitored every 1 min when the cell was exposed to isosmotic (Iso), hyposmotic (Hypo) and hyperosmotic (Hyper) solutions, respectively. Similar results were observed in seven cells. B, families of whole-cell outward currents elicited by a series of 4.5-s depolarizing voltage steps from a holding potential of −60 mV to potentials between −50 and +80 mV in 10-mV increments (inset on top) under isosmotic (a), hyposmotic (b) and hyperosmotic (c) conditions. C and D, mean I–V curves for Ipeak and Iss in mouse apex myocytes (n = 12) under isosmotic, hyposmotic and hyperosmotic conditions. Ipeak was measured as the peak of outward currents (at 10–50 ms) and Iss was measured at the end of 4.5-s voltage steps. *P < 0.05, **P < 0.01 versus isosmotic conditions.

