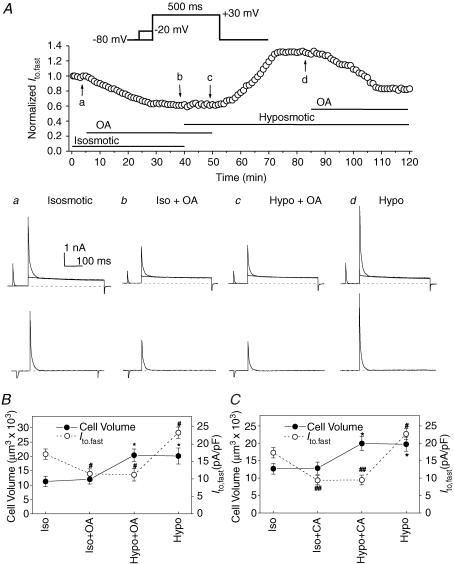
Figure 7. Effects of serine/threonine protein phosphatase inhibitors, okadaic acid and calyculin A, on Ito,fast in mouse left ventricular myocytes.
A, whole-cell currents were monitored continuously in the presence of 50 μm 4-AP (voltage-clamp protocols shown on the top, also see Fig. 3A for details). Top panel, Ito,fast was recorded every 1 min then normalized to the initial corresponding value at time 0 when cardiac myocytes were consecutively exposed to isosmotic, isosmotic + OA (100 nm), hyposmotic + OA (100 nm), and hyposmotic solutions. Changes in perfusion solutions were started when the changes in current amplitude reached the steady-state level. a–d, the representative superimposed current traces (upper) and the prepulse-sensitive difference current (Ito,fast) traces (lower) recorded from the same cell as shown in the top panel at the time points indicated by the arrows. B, changes in mean peak Ito,fast current densities (•, y-axis on the left) and cell volume (•, y-axis on the right) recorded when cells were consecutively exposed to isosmotic (Iso), isosmotic +100 nm OA (Iso + OA), hyposmotic +100 nm OA (Hypo + OA), and hyposmotic (Hypo) solutions (n = 6). Currents were obtained using the protocols described in panel A (*P < 0.05 when compared with cell volume under control (Iso) conditions; #P < 0.05 when compared with peak current density under control (Iso) conditions). C, changes in mean peak Ito,fast current densities (•) and cell volume (•) recorded from cardiac myocytes when they were consecutively exposed to isosmotic (Iso), isosmotic + 20 nm CA (Iso + CA), hyposmotic + 20 nm CA (Hypo + CA), and hyposmotic (Hypo) solutions (n = 5, *P < 0.05 when compared with cell volume under control (Iso) conditions; #P < 0.05, ##P < 0.01 when compared with peak current density under control (Iso) conditions).

