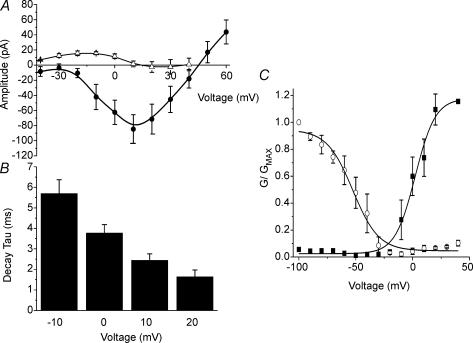
Figure 3. Biophysical properties of IFAST.
A, the current–voltage (I–V) relationship of IFAST measured at the peak inward current in the presence of 1 μm nicardipine (•) and the corresponding cells in a Na+ free external solution (▵). Removal of Na+ from the external solution abolished IFAST leaving a small outward current at negative potentials. B, a bar graph illustrating the mean voltage dependent deactivation kinetics of IFAST measured at the voltage steps indicated from a Vh=−60 mV (n = 5) calculated by fitting the data with a single exponential. C, the activation and inactivation of the channel in the presence of 1 μm nicardipine. The mean peak current values were established using a double pulse protocol in which cells were stepped from −60 mV to a range of voltages between −100 and +40 mV for 1.5 s, followed by a 250 ms step to +20 mV. Inactivation values (○) and activation (▪) were normalised to the maximal evoked current and the mean data fitted with a Boltzmann function. All data are represented as means ±s.e.m.

