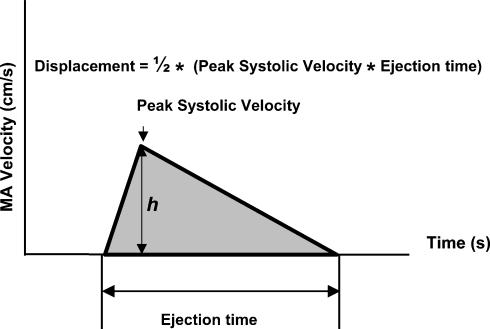
Figure 1. A simplified triangular geometry of the systolic part of the myocardial tissue velocity profile.
The base equals left ventricular (LV) ejection time, the height (h) corresponds to the peak systolic velocity, and the shaded area of the triangle (i.e. the time integral of the velocity; one-half of the base by height product) equals the long-axis left ventricular displacement. MA, mitral annulus.

