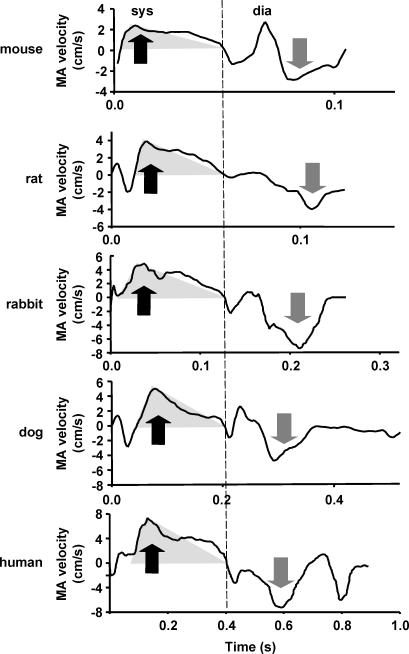
Figure 3. Typical myocardial tissue velocity profiles recorded at the septal part of the MA.
A transparent grey triangle superimposed on the ejection part of velocity profile represents its simplified triangular geometry (see Fig. 1). Note a satisfactory correspondence between the true and simplified profile in all species. Also note an increase of velocity with the increase of species size. dia, diastole; sys, systole. Black arrows, peak-systolic velocity; grey arrows, E-wave velocity. The dashed line represents end-systole.

