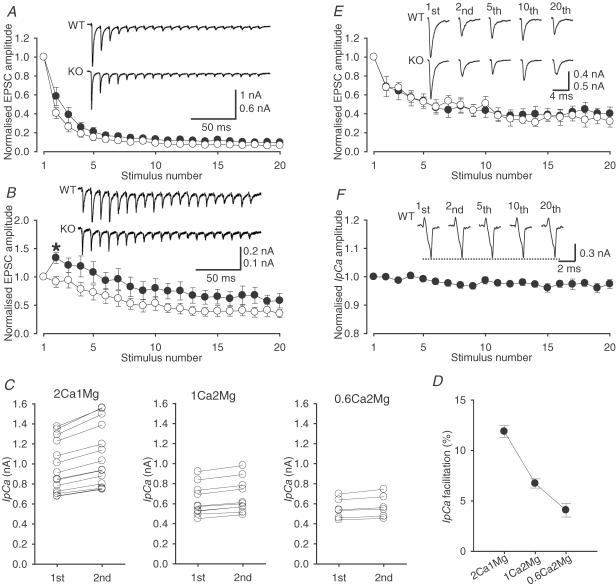
Figure 5. Activity-dependent changes in IpCa and EPSCs in KO and WT and mice.
A, EPSCs evoked by a train of 20 stimuli at 100 Hz in normal artificial cerebrospinal fluid (aCSF) in WT (upper sample trace, •) and KO (lower sample trace, ○) mice. B, EPSCs evoked by a train of 100 Hz stimulation in 1 mm [Ca2+]o (2 mm [Mg2+]o) solution in WT (•) and KO (○) mice. The asterisk indicates the point at which the EPSC amplitude in WT mice was significantly larger than that in KO mice (P < 0.05). C, the first and second amplitude of IpCa in WT mice evoked at 100 Hz (10 ms interstimulus interval) in normal aCSF (left panel), 1 mm [Ca2+]o (2 mm [Mg2+]o) solution (middle panel) and 0.6 mm [Ca2+]o (2 mm [Mg2+]o) solution (right panel). The second IpCa amplitudes were significantly larger than the first one in all solutions (P < 0.01 in paired t test). D, the mean magnitude of IpCa facilitation (%) in WT mice in three different solutions. E, EPSCs evoked by a train of 20 stimuli at 10 Hz in 1 mm [Ca2+]o (2-mm [Mg2+]o) solution in WT (•) and KO (○) mice. F, normalized amplitudes of IpCa (n = 5) in WT mice evoked by a train of 20 stimuli at 10 Hz in 1 mm [Ca2+]o (2 mm [Mg2+]o) solution. No IpCa facilitation was observed. Error bars indicate s.e.m.

