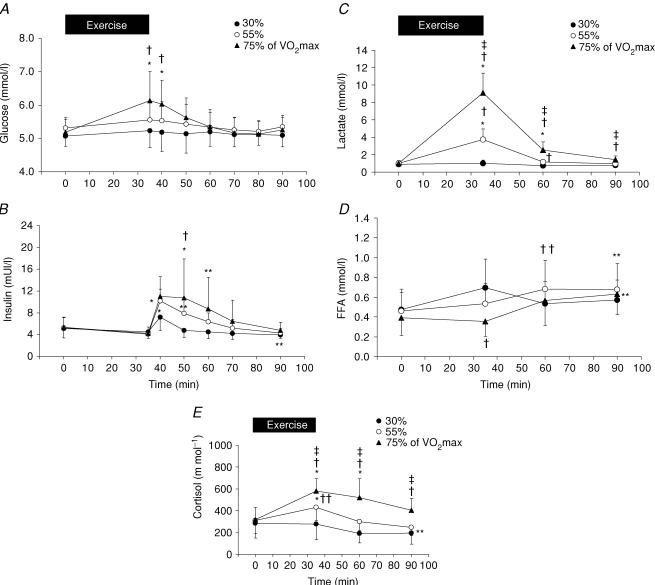
Figure 2. Time course of substrate availability and hormone output during exercise.
Plasma glucose (A), serum insulin (B), plasma lactate (C), serum FFAs (D) and serum cortisol (E) concentrations from the start of the exercise to the end of the PET scan during three different exercise intensities. Values are expressed as mean ±s.d. Number of subjects is 14. *P < 0.01 and **P < 0.05 versus baseline; †P < 0.01 and ††P < 0.05 versus 30% intensity, and ‡P < 0.01 versus 55% intensity.

