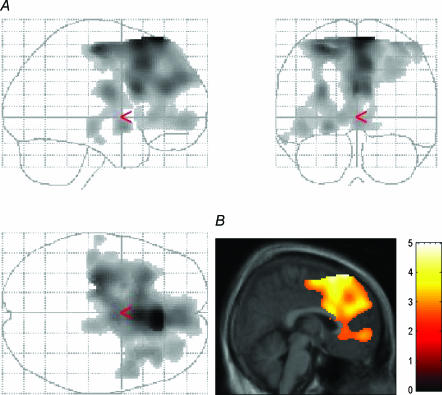
Figure 5. The effect of exercise capacity.
A, the result of voxel-based statistical analysis testing group-by-intensity level interaction. Statistical parametric map showing the region where decrease in glucose uptake between 30% and 75% of V˙O2max exercise intensities was larger in subjects with higher exercise capacity (cluster-level P < 0.001 corrected for multiple comparisons). B, this same result visualized on the MRI template image. The colour intensity scale represents T-statistic values at voxel-level.

