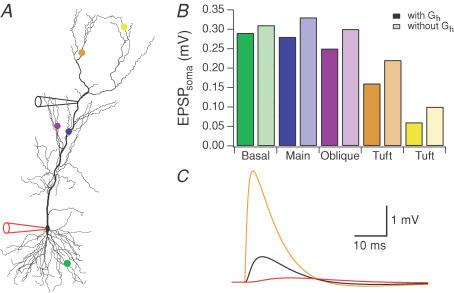
Figure 7. Simulations of EPSP attenuation for various synaptic locations.
Non-uniform Rm and Gh models for cell 3 were used in these simulations. The synaptic conductance was 1 nS with a rise time constant of 0.5 ms and a decay time constant of 5 ms. A, the five synapse locations are indicated by the coloured markers (basal site at 135 μm, green; proximal site at 290 μm, blue; side branch site at 322 μm, purple; distal apical at 583 μm, orange; and a second distal apical at 730 μm, yellow) and the somatic and dendritic recording sites are indicated by the electrode cartoons (dendritic recording electrode at 365 μm). B, bar graph showing the amplitude of the somatic EPSP for the five synapses. Results are presented for models with and without H conductance (darker bars and lighter bars, respectively). C, example of simulated EPSPs in response to activation of a distal apical synapse (orange marker in A) and measured at the synapse (orange), the dendritic recording site (black), and at the soma (red). In this example the EPSP attenuates 26-fold between the synapse and the soma.

